High Throughput Screening of S. stipitis natural isolates
Chloe Uyl
University of Kent PhD student in the Buscaino lab

Aims
Different S. stipitis natural isolates vary in their ability to produce bioethanol, but the genetic basis underlying this remains largely unknown. The aim of this project was to explore genomic and phenotypic diversity among a collection of ~40 different S. stipitis natural isolates. In order to link certain traits with improved bioethanol production/stress resistance, the collection of isolates was grown in a range of inhibitory conditions related to 2G biofuel production.
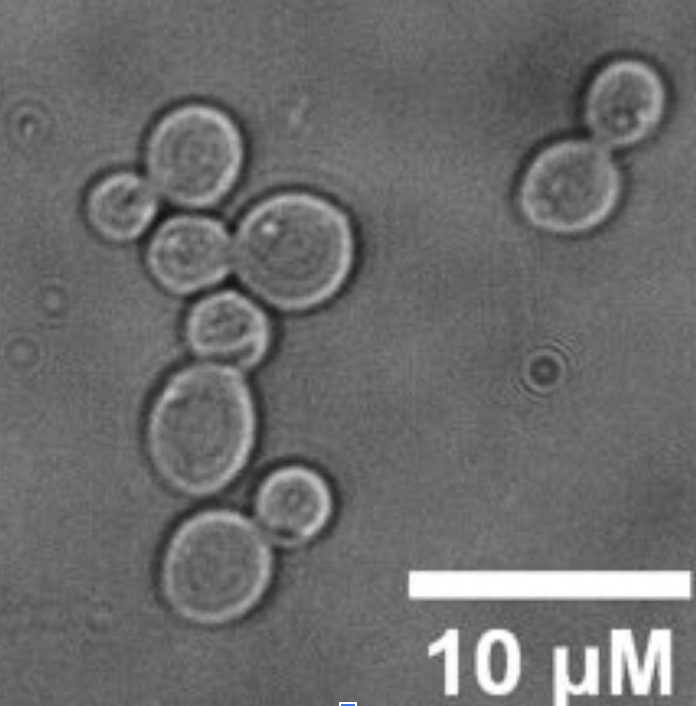
Scheffersomyces stipitis
Scheffersomyces stipitis (S. stipitis), formerly known as Pichia stipitis, is a yeast species belonging to the Saccharomycetes class within the Ascomycota phylum. It is an important microorganism in the field of biotechnology and bioengineering due to its unique characteristics and metabolic capabilities. S. stipitis is well-known for its ability to metabolise a wide range of sugars, including xylose, a five-carbon sugar found in lignocellulosic biomass. This characteristic sets it apart from many other yeasts, including the commonly used Saccharomyces cerevisiae (S. cerevisiae), which cannot efficiently ferment xylose (despite genetic modifications).
The genome of S. stipitis has been sequenced and published. S. stipitis is a haploid, homothallic yeast, with a genome 15.4Mb in size (8 chromosomes, 0.97Mb – 3.5Mb in size). Scheffersomyces stipitis is a non-conventional haploid yeast which belongs to the CTG clade (CTG codon predominantly translated as a serine instead of a leucine).
Lignocellulosic biomass & 2nd generation biofuels
S. stipitis’ capacity to metabolise xylose makes it a valuable candidate for lignocellulosic bioethanol production (2nd generation biofuel). Lignocellulosic biomass, such as agricultural residues and forestry by-products, contains significant amounts of xylose and other sugars that are difficult to ferment. Scheffersomyces stipitis’s ability to convert xylose into ethanol offers the potential to make the bioethanol production process more efficient and sustainable (using agricultural waste vs food crops).
Drawbacks of using S. stipitis for biofuel
While S. stipitis offers several advantages for 2G biofuel production, it also has some drawbacks and challenges, including, but not limited to:
- Low ethanol tolerance: S. stipitis has lower ethanol tolerance compared to other yeasts like S. cerevisiae. This can limit its productivity in the fermentation process, especially when the ethanol concentration reaches higher levels, resulting in reduced biofuel yields.
- Slow fermentation rates and limited scale-up experience
- Higher sensitivity to process conditions: such as temperature, pH, and nutrient levels. This is important as lignocellulosic biomass contains compounds such as furans and phenolics which are released during pre-treatment. These compounds can inhibit S. stipitis‘ fermentation capability and require additional detoxification steps, adding complexity and cost to the overall biofuel production process.
- Limited genetic tools, and those that do exist are not very accurate or efficient.
Materials and Methods
1. Use PIXL to create re-array
PIXL was used to create a 384 array (*3) of the S. stipitis natural isolate collection. Each array had a random layout of the different strains, and each strain was repeated ~8 times per array.
A 96 multi-well plate was filled with 250μL of YPD liquid media. Each well was inoculated with the corresponding strain (previously cultured on YPD agar plate). The array was constructed using the re-array mode on PIXL, with a well clearance of 5%, and mixing of the source plate. Each array was incubated at 30°C for 48 hours. The R script used to construct the PIXL re-array file isn’t publicly available but can be replicated by preparing a multi-well plate with the positions of colonies randomised manually. Randomly positioning the colonies is essential to counter edge effects and limit bias in the data.
2. Use ROTOR+ to replicate the array onto different growth conditions
ROTOR+ was used to replicate each 384 array (*3) onto the different growth conditions to be tested. Each array was incubated at 30°C for 48 hours before imaging for growth measurements.
3. Use prototype ColonyCam to image plates
After incubating each array at 30°C for 48 hours, the growth of the various S. stipitis strains under different conditions was assessed using the prototype ColonyCam. Colony size, measured in pixels, was used as an indicator of growth rate. Therefore, a coloured image was not required for this comparison.
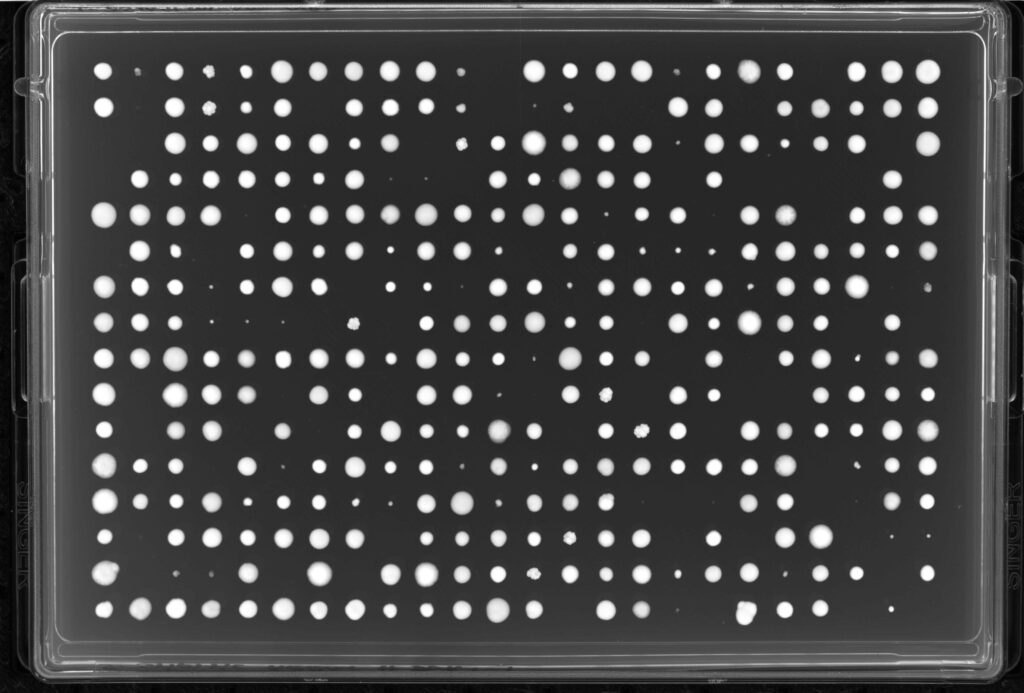
4. Analyse data using ImageJ
ImageJ was used for data analysis. Each image was cropped to contain only the 384 array without the border. A macro was recorded for the subsequent steps: converting each image to 8-bit (Image > Type > 8-bit), setting the scale to calculate pixel/mm (Analyze > set scale), and duplicating the image (Image > duplicate).
After applying a threshold to one image (Image > Adjust > Threshold > Apply), colonies were measured using Analyze > Measure Particles. The measurements could be changed using Analyze > set measurements. The following were selected: Area, standard deviation, integrated density, skewness, mean grey value, modal grey value, centroid, median and kurtosis. Size and circularity settings were adjusted for optimal detection. Manual selection or de-selection was performed for colonies that were not detected or detected inaccurately. A total of 384 colonies should be detected per image.
After determining the colony positions for each array, they were utilised to measure the growth from the original unthresholded image. Subsequently, the data was exported as a CSV file from ImageJ.
The data collected from ImageJ provided only the coordinates for each strain, requiring matching with the corresponding strain position on the target plate map. To map the positions of the strains based on the position of the colonies, a separate R script was employed to generate an aggregated and concatenated file for each array per condition.
Subsequently, for each condition, the three concatenated files were combined and further processed using a second R script. This step yielded another aggregated and concatenated file for each condition, with exclusions made for strains located at the edge of the array (to avoid edge effects) and for the average of the three arrays (as each array had a distinct position for each strain).
Conclusion
This project successfully profiled the ability of different S. stipitis strains to metabolise various sugars relevant to bioethanol production/stress resistance.
Without automation, finding the best strain for the job would be a pain
Done manually, strain optimisation can take years. Learn how to gradually build a automated workflow to take the strain out of strain optimisation.